Overview
The following Data & AI (Artificial Intelligence) reports have been created from randomised data. The data has then been sent to our API (Application Programming Interface), which has then been processed by our AI to match the users across different platforms. The resulting data can either be picked up directly by the client via our export API for automated processing internally and / or can be visualised via our pre-built dashboards. There are many and varied possibilities for the visualisation of this data and the images that follow show some of our pre-built fully functioning dashboards.
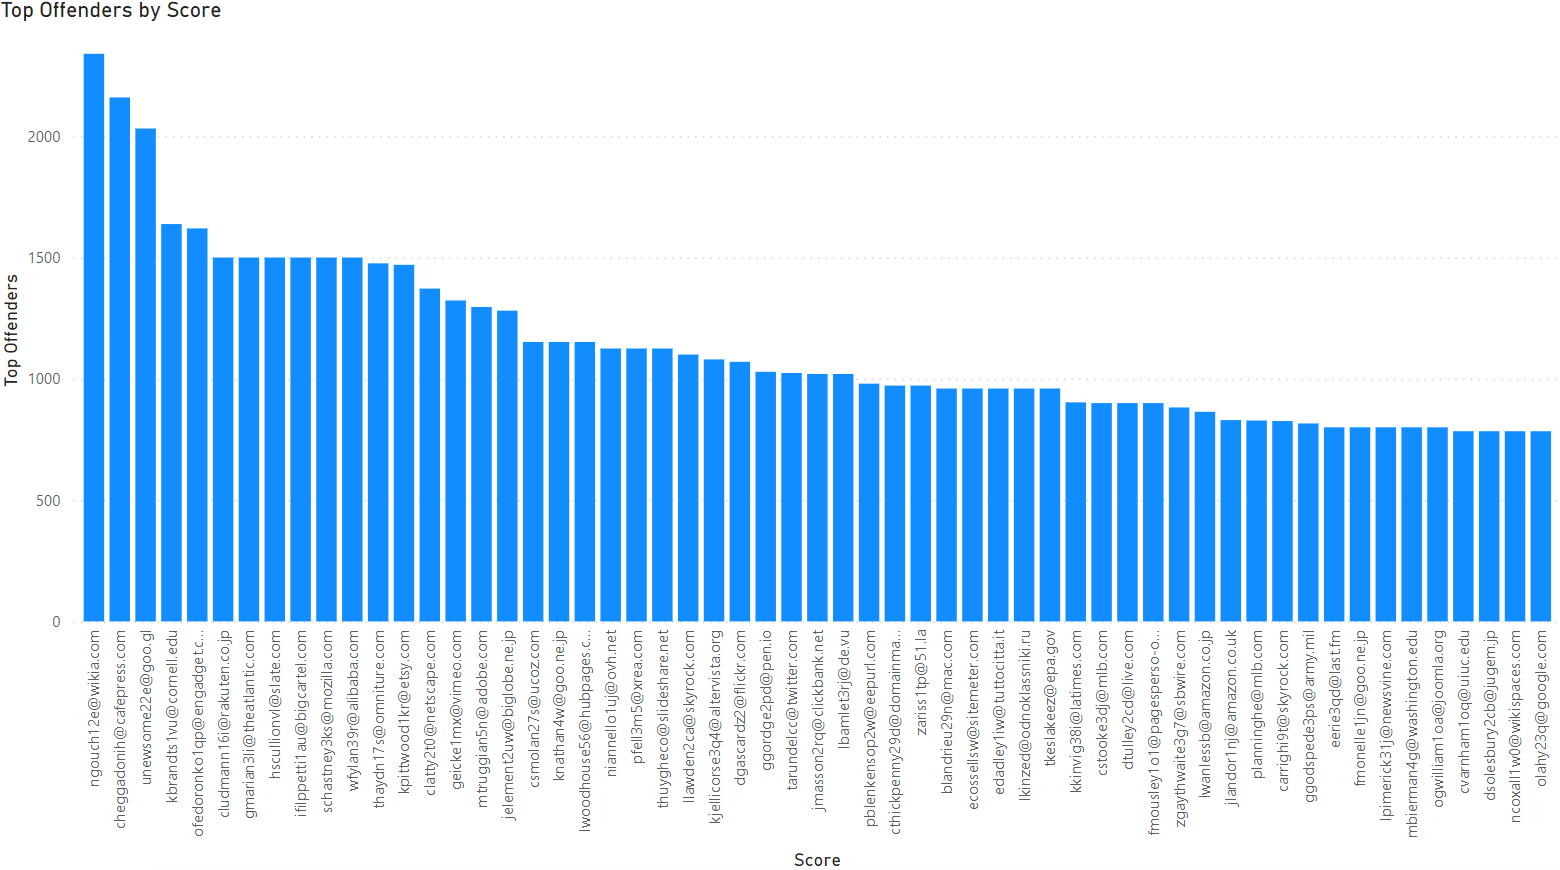
Score
Our most powerful Data & AI report is shown below, it displays the worst offenders easily. The higher the score, the more offences of the worst type which have been shown to the biggest audience:
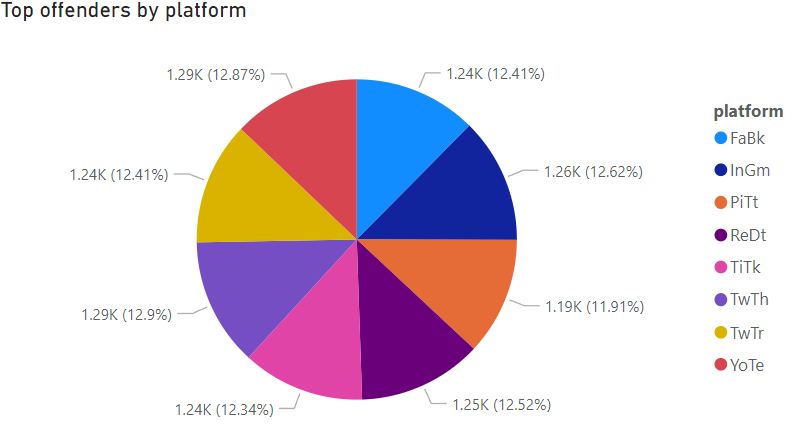
Top offenders by platform
The split of the platforms that all the offenders are operating on, showing user count and percentage. The platform key shows (in order), Facebook, Instagram, Pinterest, Reddit, Tiktok, Twitch, Twitter and YouTube:
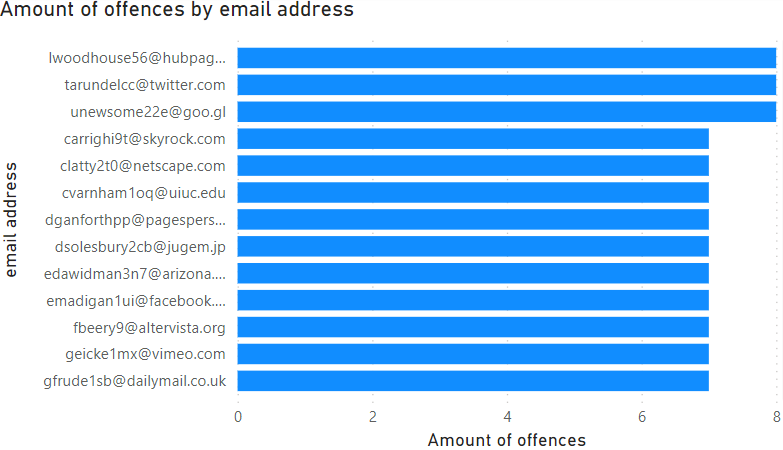
Amount of offences by email address
Top offenders by email address or username, along with the amount of offences they have been matched to across all platforms:
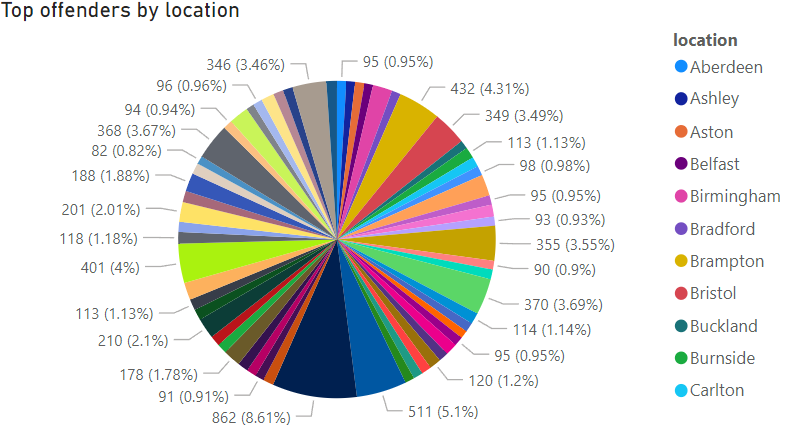
Top offenders by location
The towns of all offenders and highest prevalence of offenders per town:
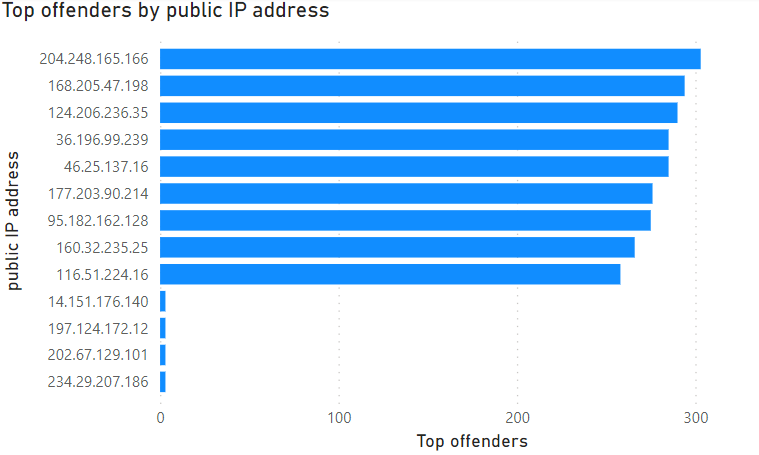
Top offenders by public IP address
Top offenders by public IP, along with the amount of offences per IP:
